오늘은 이어서 파이썬 기본 시각화 tool인 Matplotlib에 대해서 살펴보겠습니다.
이전 글 입니다!
2020/10/16 - [Visualization] - 파이썬 시각화 - Matplotlib 기초(Tutorial) - 1
파이썬 시각화 - Matplotlib 기초(Tutorial) - 1
오늘은 파이썬에서 기본적으로 많이 사용하는 시각화 tool인 Matplotlib으로 다양한 그래프를 그려보았습니다. *위키독스에서 [Matplotlib Tutorial - 파이썬으로 데이터 시각화하기] 책을 참고했습니다.
coding-moomin.tistory.com
오늘 배울 내용은 막대그래프, 산점도, 3차원 산점도, 히스토그램, 에러바, 파이차트를 그리는 법을 알아보겠습니다.
(1) 막대그래프 그리기 (bar)
- width : 막대의 너비 (디폴트: 0.8)
- align : 틱 (tick)과 막대의 위치를 조절 (디폴트 : ‘center’) ‘edge’ : 막대의 왼쪽
- color : 막대의 색
- edgecolor : 막대의 테두리 색
- linewidth: 테두리의 두께
- tick_label : tick에 array의 문자열 표현 가능 (array 형태로 지정)
- log=True : y축이 log-scale
x = np.arange(3)
years = ['2017', '2018', '2019']
values = [100, 400, 900]

plt.bar(x, values, width=0.6, align='edge', color="magenta",
        edgecolor="aqua", linewidth=3, tick_label=years, log=True)
plt.show()
축 돌려서 그리기 - barh()
# 돌리기
x = np.arange(3)
years = ['2017', '2018', '2019']
values = [100, 400, 900]
## height : 디폴트(-0.8)
plt.barh(x, values, height = - 0.6, align='edge', color="magenta",
        edgecolor="aqua", linewidth=3, tick_label=years, log=True)
plt.show()
(2) 산점도 그리기(scatter)
아래 코드는 랜덤하게 50개의 0~1사이의 x, y 그리고 색상, 면접을 뽑고 이를 산점도로 그린것 입니다.
np.random.seed(20201016)

N = 50
x = np.random.rand(N)
y = np.random.rand(N)
colors = np.random.rand(N)
area = (30 * np.random.rand(N))**2

#scatter(x, y, 마커의 면적, 마커의 색상, 투명도)
plt.scatter(x, y, s=area, c=colors, alpha=0.5)
plt.show()
3차원 산점도
from mpl_toolkits.mplot3d import Axes3D
import matplotlib.pyplot as plt
import numpy as np

n = 100
xmin, xmax, ymin, ymax, zmin, zmax = 0, 20, 0, 20, 0, 50  #xs, ys는 0에서 20 사이, zs는 0에서 50 사이 값
cmin, cmax = 0, 2 #color는 0에서 2 사이의 값을 갖는 실수
xs = np.array([(xmax - xmin) * np.random.random_sample() + xmin for i in range(n)])
ys = np.array([(ymax - ymin) * np.random.random_sample() + ymin for i in range(n)])
zs = np.array([(zmax - zmin) * np.random.random_sample() + zmin for i in range(n)])
color = np.array([(cmax - cmin) * np.random.random_sample() + cmin for i in range(n)])

plt.rcParams["figure.figsize"] = (6, 6) #  figure의 사이즈를 설정
fig = plt.figure()
ax = fig.add_subplot(111, projection='3d') # 3차원
ax.scatter(xs, ys, zs, c=color, marker='o', s=15, cmap='Greens')
plt.show()
(3) 히스토그램 그리기(hist)
- bins : 몇 개의 영역으로 쪼개는지
- density=True : 밀도 함수
- alpha : 투명도
- histtype : ‘step'(내부 비어있음) , ‘stepfilled’ (내부 채워짐)
a = 2.0 * np.random.randn(10000) + 1.0 # a ~ N(1, 2)
b = np.random.standard_normal(10000) #b~ N(0,1)
c = 20.0 * np.random.rand(5000) - 10.0 # -10~10 사이 랜덤 난수 생성


plt.hist(a, bins=100, density=True, alpha=0.7, histtype='step')
plt.hist(b, bins=50, density=True, alpha=0.5, histtype='stepfilled')
plt.hist(c, bins=100, density=True, alpha=0.9, histtype='step')
plt.show()
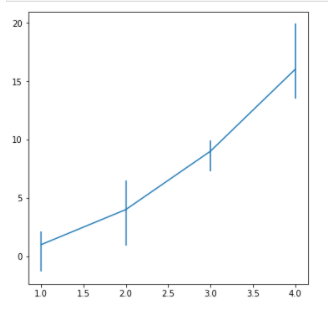
(4) 에러바 그리기(errorbar)
비대칭 편차
x = [1, 2, 3, 4]
y = [1, 4, 9, 16]
yerr = [(2.3, 3.1, 1.7, 2.5), (1.1, 2.5, 0.9, 3.9)]

plt.errorbar(x, y, yerr=yerr)
plt.show()
상한/하한 기호 표시하기

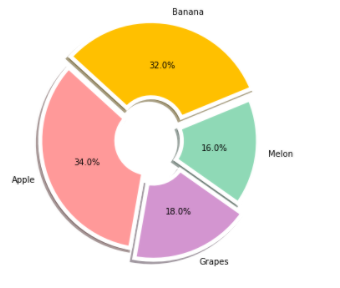
(5) 파이차트 그리기
- autopct : 숫자 형식
- explode : 부채꼴이 파이 차트의 중심에서 벗어나는 정도
- startangle : 부채꼴이 그려지는 시작 각도
- counterclock : 시계방향 (False) / 반시계(True)
- shadow : 그림자 설정
- wedgeprops: 부채꼴 영역의 스타일을 설정
예시 설명
autopct='%.1f%%' :소수점 첫째자리
startangle = 260 : 부채꼴의 각도는 260도로 시작해서
counterclock=False : 시계방향으로
shadow = True : 그림자도 그리고
explode = [0,10,0,10] : Banana와 Grapes만 중심에서 10만큼 벗어나게(explode)
wedgeprops={'width': 0.7, 'edgecolor': 'w', 'linewidth': 5} : 전체 반지름 중 70%만 그리고, 테두리는 하얀색에 두께는 5
ratio = [34, 32, 16, 18]
labels = ['Apple', 'Banana', 'Melon', 'Grapes']
colors = ['#ff9999', '#ffc000', '#8fd9b6', '#d395d0']
explode = [0, 0.10, 0, 0.10]
wedgeprops={'width': 0.7, 'edgecolor': 'w', 'linewidth': 5} # width :부채꼴 영역의 너비 (반지름에 대한 비율)/ edgecolor : 테두리의 색상 / linewidth테두리 선의 너비

plt.pie(ratio, labels=labels, autopct='%.1f%%', startangle=260, counterclock=False, explode= explode, colors=colors, wedgeprops=wedgeprops)
plt.show()

'etc > Visualization' 카테고리의 다른 글
| [Python] OpenCV로 이미지에 글자 합성하기 (0) | 2020.12.01 |
|---|---|
| [Python] Matplotlib 기초(Tutorial) - 1 (0) | 2020.10.16 |